# Load dependencies
import pandas as pd
import matplotlib.pyplot as plt
import numpy as np
from scipy.stats import gmean
import sys
sys.path.insert(0, '../../../statistics_helper/')
from fraction_helper import *
from excel_utils import *

# Define function that runs a jypyter notebook and saves the results to the same file
def run_nb(path):
    import nbformat
    from nbconvert.preprocessors import ExecutePreprocessor
    import os
    with open(path) as f:
        nb = nbformat.read(f, as_version=4)
        ep = ExecutePreprocessor(timeout=6000, kernel_name='python3')
        ep.preprocess(nb, {'metadata': {'path': os.path.dirname(path)}})
    with open(path, 'wt') as f:
        nbformat.write(nb, f)
Estimating the biomass of marine arthropods
To estimate the biomass of marine arthropods, we rely on data from the marine ecosystem biomass data (MAREDAT) initiative. The MAREDAT database contains measurements of the biomass concentration for each plankton group. From this database Buitenhuis et al. generates estimates for the global biomass of each plankton group by using a characteristic biomass concentration for each depth (either a median or average of the values in the database) and applying it across the entire volume of ocean at that depth. Buitenhuis et al. reports two estimates, one based on the arithmetic mean of concentrations at each depth, and one based on the median concentrations at each depth. The estimate based on the arithmetic mean is more susceptible to sampling bias, as even a single measurement which is not characteristic of the global population (such as samples which are in coastal waters, or samples which have some technical biases associated with them) might shift the average concentration significantly. On the other hand, the estimate based on the geometric mean might underestimate global biomass as it will reduce the effect of biologically relevant high biomass concentrations. As a compromise between these two caveats, we chose to use as our best estimate the geometric mean of the estimates from the two methodologies.
The data in the MAREDAT database is divided into plankton size classes: microzooplankton (zooplankton between 5 and 200 µm in diameter), mesozooplankton (zooplankton between 200 and 2000 µm in diameter) and macrozooplankton (zooplankton between 2 and 10 mm). We are interested in the biomass of arthropods in each class.
Microzooplankton
Microzooplankton was defined in the MAREDAT databased as to exclude copepod biomass, and thus its contribution to the total biomass of marine arthropods is neglegible.
Mesozooplankton
Mesozooplankton might contain several different kinds of animal and protist taxa. We argure that the main contribution to the mesozooplankton category in MAREDAT database comes from arthropods (mainly copepods). To substantiate this claim, we rely on 18S rDNA sequencing data from the Tara Oceans campaign reported in de Vargas et al.. In figure W10A in the companion website to the paper the authors detail abundance of 18S rDNA reads for different animal and protist taxa: <img src= "http://taraoceans.sb-roscoff.fr/EukDiv/images/FigW-10-1.png">
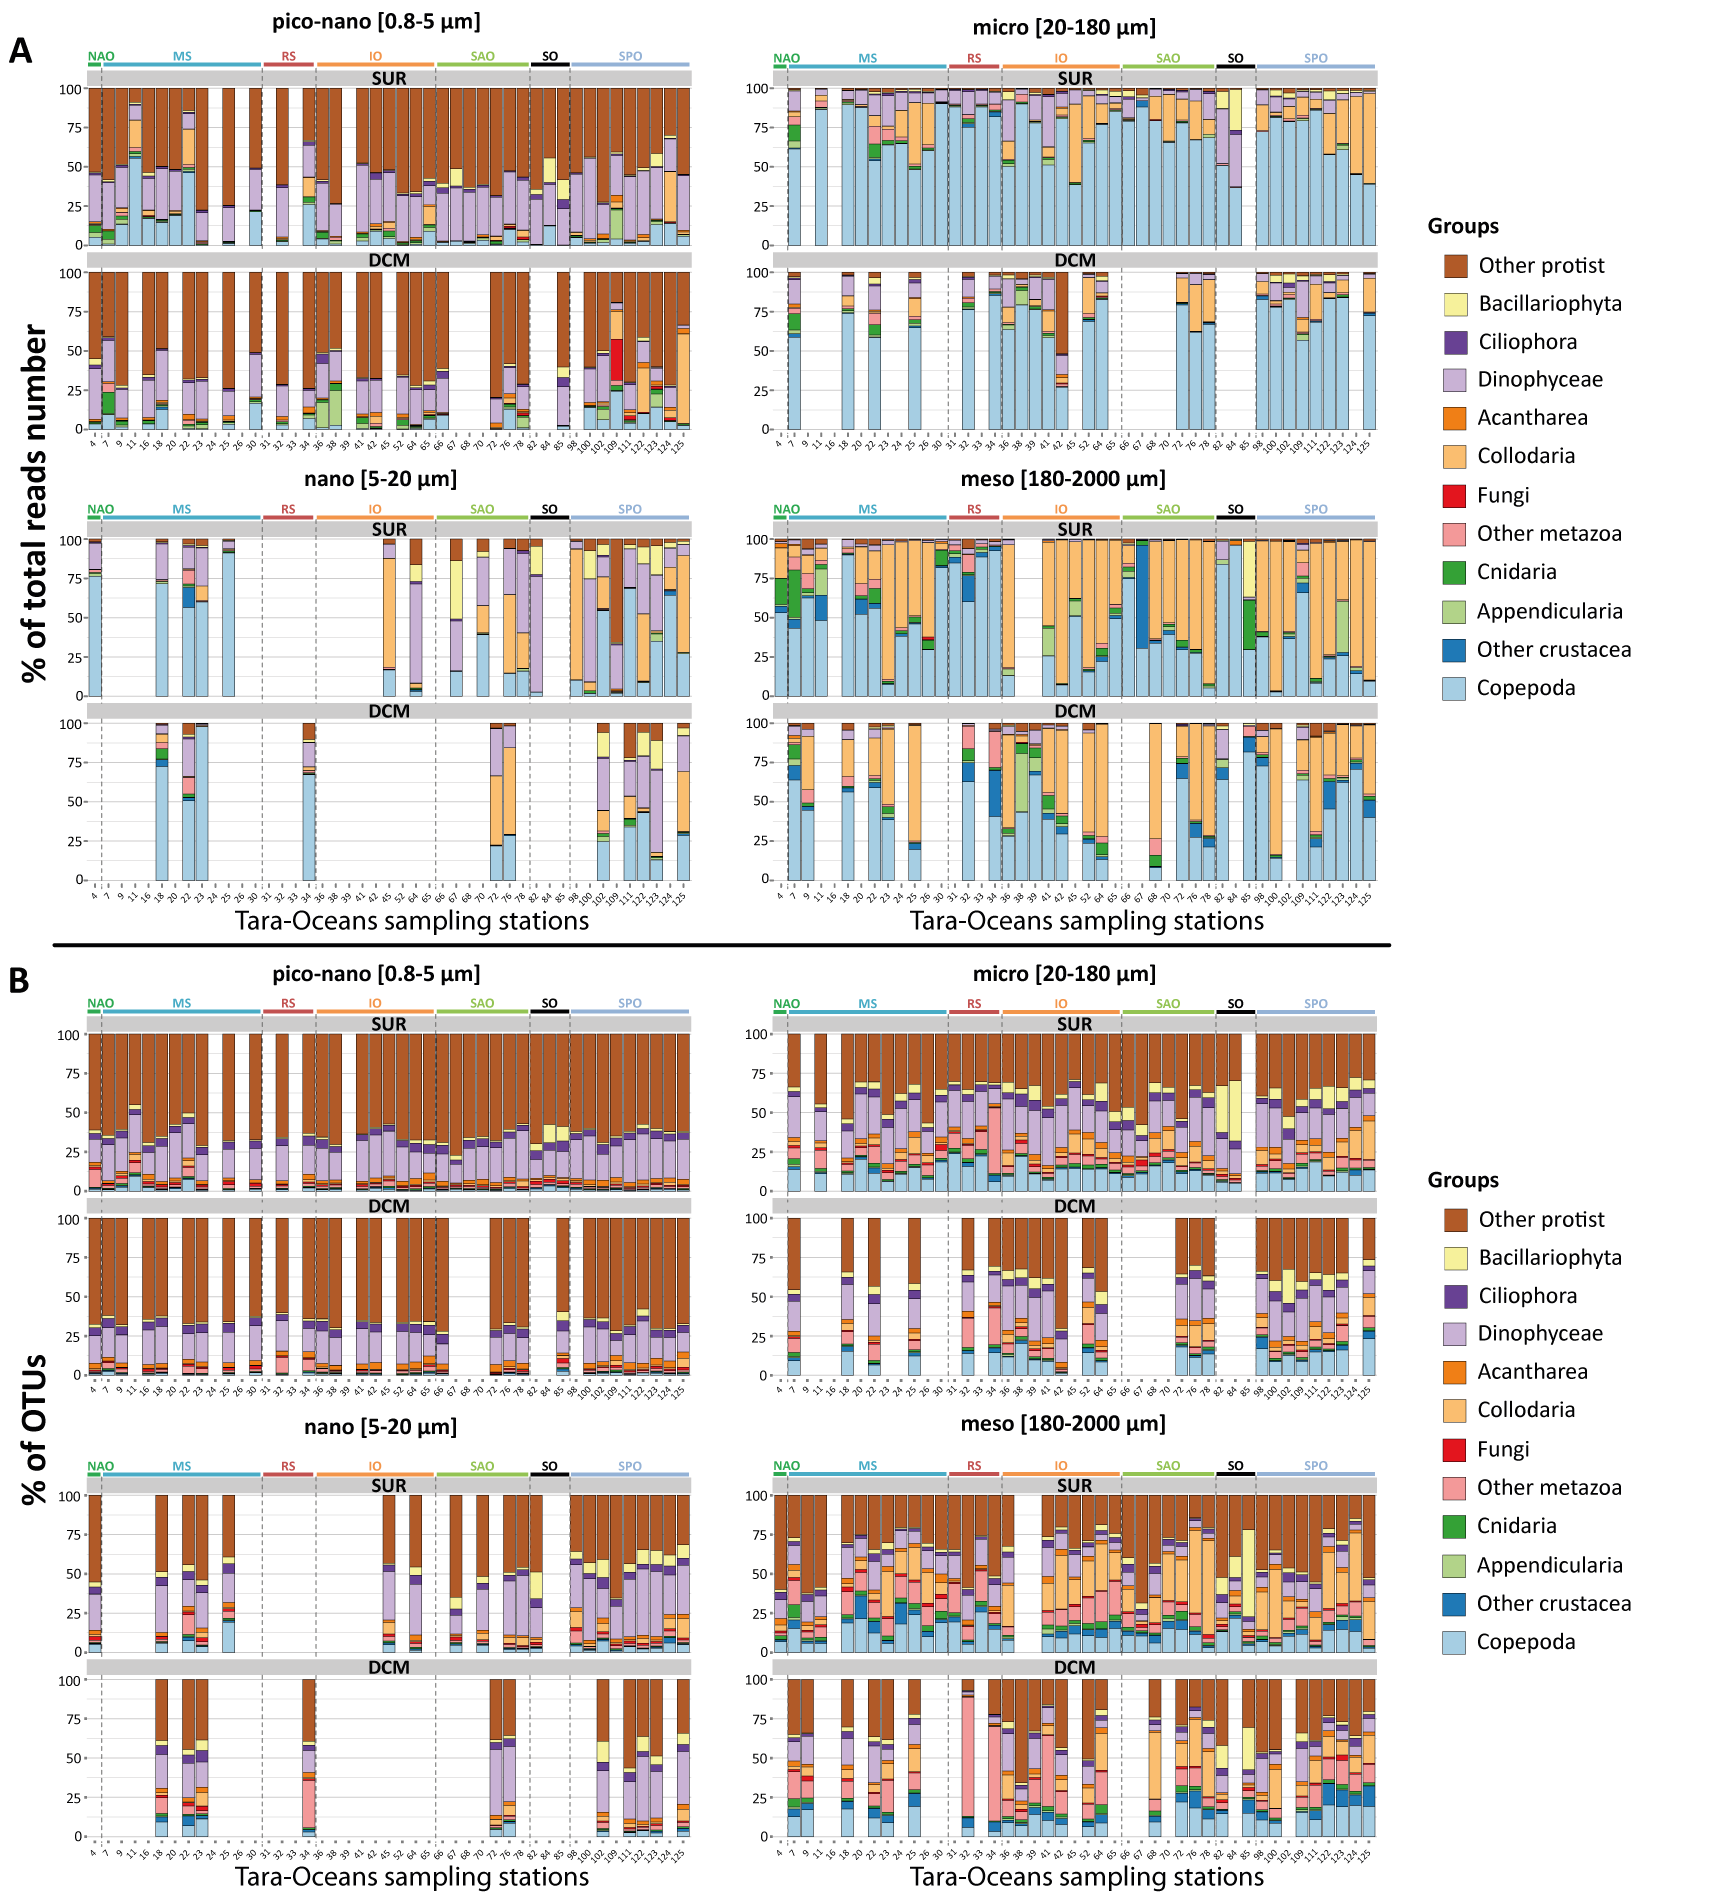
Can 18S rDNA data be used to estimate biomass contribution?
It is not obvious that data on the relative abundance of 18S sequences can be used in order to estimate the relative biomass contribution of different taxa. We provide two independent lines of evidence of the legitimacy of using the 18S data in de Vargas et al. in order to claim that arthropod dominate the biomass of mesozooplanktonin the MAREDAT data.
The first line of evidence is in figure W3 in the companion website: 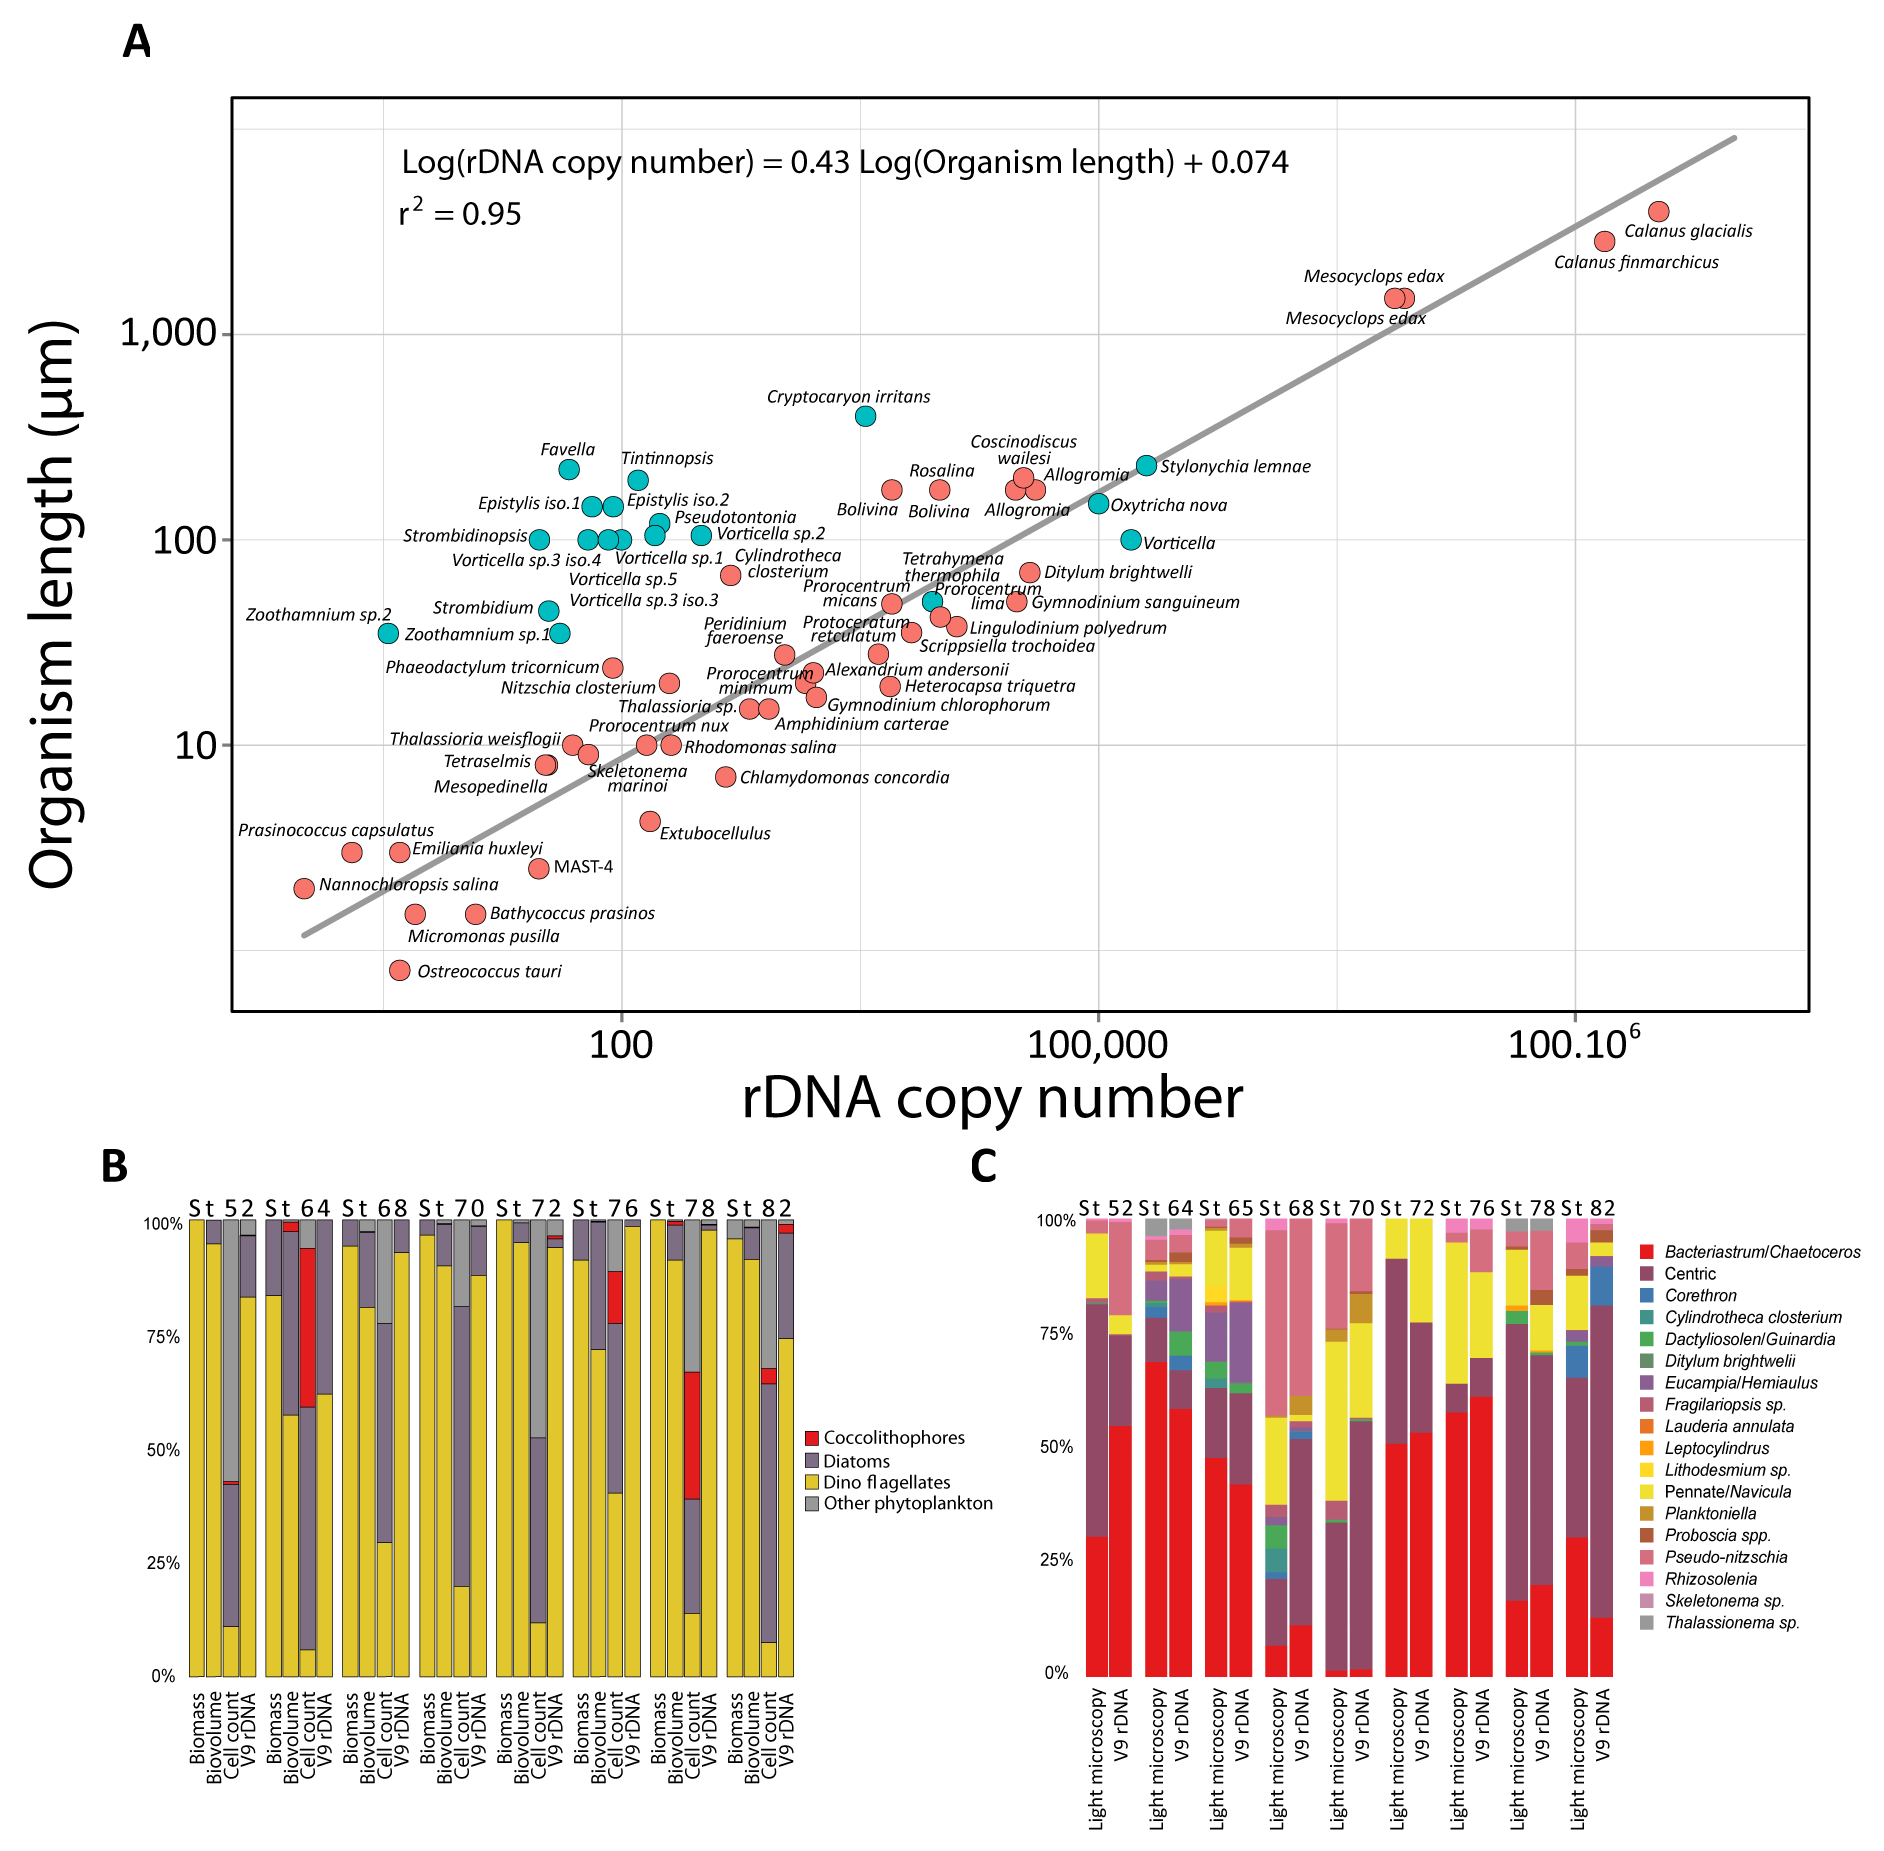
This figure shows good correlations between the rDNA content in a cell and the cell size, as well as correlation between microscopy data and 18S rDNA sequencing data.
The second line of evidence is a comparison of the relative fraction of Rhizaria in the 18S rDNA data with data from in-situ imaging (Biard et al.). We estimate the average relative fraction of Rhizaria in it the 18S rDNA sequencing data:
# Load 18S sequecing data
seq_data = pd.read_excel('marine_arthropods_data.xlsx',sheet_name='de Vargas',skiprows=1)

print('The average fraction of Rhizaria in 18S rDNA sequencing data in surface waters is ' + '{:,.0f}%'.format(seq_data['Rhizaria surface'].mean()*100))
print('The average fraction of Rhizaria in 18S rDNA sequencing data in the deep chlorophyll maximum is ' + '{:,.0f}%'.format(seq_data['Rhizaria DCM'].mean()*100))
These fraction of 35-40% are very close to the average fraction reported by Biard et al. using imaging data of ≈33%.
The biomass contribution of arthropod to mesozooplankton data in MAREDAT
To calculate the contribution of arthropods to the biomass data in the MAREDAT database, we assume the representation of Rhizaria in the MADERAT data is limited, as Biard et al. indicated that they are usually undersampled because many of them are delicate and are severely damaged by plankton nets or fixatives used in surveys such as the ones used to build the MAREDAT. Therefore, we calculate the relative contribution of arthropods to the total population of mesozooplankton excluding Rhizaria:
# Define the relative fraction of arthropods out of the total mesozooplankton excluding Rhizaria
arth_frac_surf = seq_data['Arthropod surface']/(1-seq_data['Rhizaria surface'])
arth_frac_dcm = seq_data['Arthropod DCM']/(1-seq_data['Rhizaria DCM'])

# Calculate the mean fraction of arthropods in surface waters and the DCM
mean_arth_frac_surf = frac_mean(arth_frac_surf)
mean_arth_frac_dcm = frac_mean(arth_frac_dcm)
print('The average fraction of arthropods out of the total biomass of mesozooplankton in surface waters excluding Rhizaria is '+'{:,.0f}%'.format(mean_arth_frac_surf*100))
print('The average fraction of arthropods out of the total biomass of mesozooplankton in the deep chlorophyll maximum excluding Rhizaria is '+'{:,.0f}%'.format(mean_arth_frac_dcm*100))
Overall, we use ≈80% for the fraction of arthropods out of the total biomass of mesozooplankton in the MAREDAT database.
To estimate the biomass of mesozooplankton arthropods, we rely on the global estimates made by Buitenhuis et al. based on the MAREDAT data. Buitenhuis et al. generated two estimates for the global biomass of mesozooplankton by using a characteristic biomass concentration for each depth (either a median or average of the values in the database) and applying it across the entire volume of ocean at that depth. This approach results in two types of estimates for the global biomass of mesozooplankton: a so called “minimum” estimate which uses the median concentration of biomass from the database, and a so called “maximum” estimate which uses the average biomass concentration. Because the distributions of values in the database are usually highly skewed by asymmetrically high values, the median and mean are loosely associated by the MAREDAT authors with a minimum and maximum estimate. The estimate based on the average value is more susceptible to biases in oversampling singular locations such as blooms of plankton species, or of coastal areas in which biomass concentrations are especially high, which might lead to an overestimate. On the other hand, the estimate based on the median biomass concentration might underestimate global biomass as it will reduce the effect of biologically relevant high biomass concentrations. Therefore, our best estimate of the biomass of mesozooplakton is the geometric mean of the “minimum” and “maximum” estimates. Buitenhuis et al. reports a "minimum" estimate of 0.33 Gt C and a "maximum" estimate of 0.59 Gt C. We calculate the geometric mean of those estimates:
# Calculate the geometric mean of the "minimum" and "maximum" estimates from Buitenhuis et al.
buitenhuis_estimate = gmean([0.33e15,0.59e15])
We than use 80% of the geometric mean as an estimate for the biomass of mesozooplankton arthropods:
# Calculate the mean fraction of arthropods between surface water and DCM
arth_frac = frac_mean(np.array([mean_arth_frac_dcm,mean_arth_frac_surf]))

# Calculate the fraction of mesozooplankton biomass that is arthropod biomass
meso_arth_biomass = buitenhuis_estimate*arth_frac
Most of the data in the MAREDAT databased was collected using 300 µm nets, and thus some of the lower size fraction of mesozooplankton was not collected. To correct for this fact, we use a relation between biomass estimated using 200 µm nets and 300 µm nets O'brian 2005. The relation is: $$ B_{300} = 0.619× B_{200}$$ Where $B_{300}$ is the biomass sampled with 300 µm nets and $B_{200}$ is the biomass sampled with 200 µm nets. We correct for this factor to get our best estimate for the biomass of mesozooplankton arthropods:
# Correct for the use of 300 µm nets when sampling mesozooplankton biomass
meso_arth_biomass /= 0.619

print('Our best estimate for the biomass of mesozooplankton arthropods is ≈%.2f Gt C' % (meso_arth_biomass/1e15))
Macrozooplankton
Some arthropods are also included in the macrozooplankton size category (zooplankton between 2 and 10 mm). Macrozooplankton contains organisms from many phyla such as arthropods, cnidarians, chordates, annelids, molluscs, ctenophores and representatives from Chaetognatha (a phylum of pelagic worms). To estimate the biomass of macrozooplankton arthropods, we first estimate the total biomass of macrozooplankton, and then estimate the fraction fo this total biomass that is contributed by arthropods.
To estimate the total biomass of macrozooplankton, we rely on data from the MAREDAT database. We use the estimates of macrozooplankton biomass Buitenhuis et al. generated from the MAREDAT database. To generate these estimates, Buitenhuis et al. followed the same procedure as we detailed in the mesozooplankton section above. Buitenhuis et al. provides “minimum” and “maximum” estimates of the total biomass of macrozooplankton, which are 0.2 Gt C and 1.5 Gt C, respectively. We use the geometric mean of those estimates as our best estimate for the biomass of macrozooplankton:
macro_biomass = gmean([0.2e15,1.5e15])
print('Our best estimate for the biomass of macrozooplankton is ≈%.1f Gt C' %(macro_biomass/1e15))
From this total biomass we subtract our estimates for the biomass of pteropods, which are in the same size range as macrozooplankton. For details on the estimate of the biomass of pteropods see the molluscs section in the Supplementary Information. We estimate the total biomass of pteropods at 0.15 Gt C.
We also subtract from the total biomass of macrozooplankton the contribution by gelatinous zooplankton which also contains some species in the same size range as macrozooplankton. We estimate a global biomass of ≈0.04 Gt C (for details on the estimate of the biomass of gelatinous plankton see the cnidarians section in the Supplementary Information).
# Calculate the total biomass of macrozooplankton arthropods by
# subtacting the biomass of pteropods and gelatinous zooplankton
# from the total biomass of macrozooplankton

# Load biomass estimates for pteropods and gelatinous zooplankton
other_macrozooplankton = pd.read_excel('marine_arthropods_data.xlsx','Other macrozooplankton')

# In other zooplankton biomass estimate is empty, run the scripts
if(other_macrozooplankton.shape[0]<2):
    run_nb('../../cnidarians/cnidarians.ipynb')
    run_nb('../../molluscs/molluscs.ipynb')
    other_macrozooplankton = pd.read_excel('marine_arthropods_data.xlsx','Other macrozooplankton')

macro_arth_biomass = macro_biomass - other_macrozooplankton['Value'].sum()
print('our best estimate for the total biomass of macrozooplankton arthropods is ≈%.1f Gt C' %(macro_arth_biomass/1e15))
We sum up the biomass of arthropods in the mesezooplankton and macrozooplankton size fractions as our best estimate for the biomass of marine arthropods:
best_estimate = meso_arth_biomass+macro_arth_biomass
print('Our best estimate for the biomass of marine arthropods is %.1f Gt C' %(best_estimate/1e15))
Uncertanity analysis
We discuss the uncertainty of estimates based on the MAREDAT database in a dedicated section in the Supplementary Information. We crudly project an uncertainty of about an order of magnitude.
# We project an uncertainty of an order of magnitude (see MAREDAT consistency check section)
mul_CI = 10
Estimating the total number of marine arthropods
We consider only the mesozooplankton as they are the smallest group of marine arthropods (by the definitions of the MAREDAT database they also contain microzooplankton). To estimate the total number of marine arthropods, we divide our estimate for the total biomass of mesozooplankton by an estimate for the characteristic carbon content of an individual copepod, which dominate the mesozooplankton biomass. As the basis of our estimate for the charactristic carbon content of a single copepod, we rely on data from Viñas et al. and Dai et al., which range from 0.15 µg C to 100 µg C per individual. We use the geometric mean of this range, which is ≈4 µg C per individual, as our best estimate of the carbon content of a single copepod.
# The carbon content of copepods
copepod_carbon_content = 4e-6

# Calculate the total number of marine arthropods
marine_arth_num = meso_arth_biomass/copepod_carbon_content

print('Our best estimate for the total number of marine arthropods is ≈%.0e' % marine_arth_num)
# Feed results to the animal biomass data
old_results = pd.read_excel('../../animal_biomass_estimate.xlsx',index_col=0)
result = old_results.copy()
result.loc['Marine arthropods',(['Biomass [Gt C]','Uncertainty'])] = (best_estimate/1e15,mul_CI)

result.to_excel('../../animal_biomass_estimate.xlsx')

# Feed results to Table 1 & Fig. 1
update_results(sheet='Table1 & Fig1',
               row=('Animals','Marine arthropods'),
               col=['Biomass [Gt C]', 'Uncertainty'],
               values=[best_estimate/1e15,mul_CI],
               path='../../../results.xlsx')


# Feed results to Table S1
update_results(sheet='Table S1',
               row=('Animals','Marine arthropods'),
               col=['Number of individuals'],
               values=marine_arth_num,
               path='../../../results.xlsx')